| Discipline: | Decrease the likelihood of making emotional decisions during periods of market turbulence. |
| Recovery: | Minimize the time required to recover from portfolio drawdowns by limiting or eliminating losses during bear markets. |
| Preservation: | Reduce portfolio volatility to lower the risk of a devastating financial loss, one that could derail retirement objectives. |
| Income: | Maintain a sustainable level of portfolio withdrawals for cash flow and retirement income needs. |

J.P. Morgan was once asked for a stock-market forecast and famously replied: “It will fluctuate.” Perhaps no other market prediction has endured the test of time more than the famous banker’s observation. Volatility (or fluctuation) is present in all financial markets; it reflects the uncertainty associated with investor’s expectations over time. Unfortunately the existence of volatility is a double-edged sword – while it can create opportunity it can also create financial tragedy under the wrong circumstances. Managing volatility is especially important for investors that are near retirement or are already depending on their portfolios to generate a sustainable income stream.
One of the standard principles of finance is that risk or volatility is inextricably linked to returns. Presumably, higher risk equals higher reward. From an asset class perspective this is generally true. For example, more volatile assets such as equities have higher long-term returns than bonds. Of course the problem is that equities can have heart-wrenching drawdowns like in 2008. As a consequence, buy and hold investors must accept uncertainty as a fact of life in order to be well-compensated. However, passive investing is not as easy as it sounds – its allure comes from looking at theoretical historical returns that investors cannot seem to ever be able to capture in reality. This is because high levels of volatility can make investors very emotional and cause them to make poor investment decisions. Investors in retirement arguably have even stronger emotional reactions to the markets because they no longer have the cushion of a working salary. The research shows that these behavioral biases cause investors to substantially underperform passive benchmarks (see Dalbar). As a consequence, a passive buy and hold approach is difficult to execute successfully in practice.
If the equity markets always go straight up, your best choice for asset allocation is often to just buy and hold equities. Unfortunately, markets do not go straight up. According to a study by Flexible Plan Investments from 1928-2014, the S&P500 was in a bull market only 60% of the time. During the other 40% of the time, the index either lost money (bear market) or did not make any progress (sideways market). If you are an investor in retirement, this means that you are either dipping into your capital to make withdrawals when your portfolio isn’t earning a return, or when your portfolio is falling during bear markets. As a consequence, a buy and hold approach is not always optimal when you are seeking retirement income from your portfolio. Investors need an investment solution for all market conditions.
The basic math of compounding is one of the factors that works against investors when their portfolios go down. The same percentage loss costs you more than an equivalent gain, and this relationship is amplified as a function of volatility.
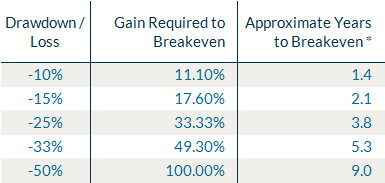
*number of years to recover from a given drawdown to be at the original account balance.
Large drawdowns in bear markets can require substantial gains and also long periods of time for an investor to recover. It is best to think about drawdowns like digging yourself into a hole – the deeper you go, the harder it is to get out. This is true in absolute terms, but is crushing for investors in retirement. Suppose you start with $1,000,000 and wish to withdraw $50,000 per year in retirement income. If you lost 50% during a market, you would now have $500,000 and would be trying to still withdraw $50,000, which means you need to make 10% per year just to break even. If the market goes sideways for two years after that, you will have $400,000 after withdrawals. Now you have to make 12.5% per year just to breakeven (50,000/400,000). Furthermore, it is highly unlikely you will ever recover to your starting point of $1,000,000 ever again. If expectations for future returns are low, it is very likely you will run out of money at some point during retirement.
The example above is simplistic because it covers only one possible scenario. To mathematically demonstrate the havoc that volatility can have on retirement portfolios in a more precise way we can use Monte Carlo simulation. In other words, we can create a variety of possible market scenarios and string them together into one simulation and repeat that process thousands or even millions of times and see the possible outcomes. These alternate paths give advisors a better sense of what could happen to their client portfolios given different market conditions and help them determine whether their financial planning assumptions are realistic. Using the Stochastic Present Value method proposed by Moshe Milevsky, a finance professor at Canada’s York University, we can easily approximate the outcome of millions of simulations using a formula.
The model for quantifying the risk of financial ruin and the sustainable withdrawal rate given a low probability of failure uses four different inputs:
- Life Expectancy – how long an investor is expected to live on average given their current age;
- Expected Withdrawal Rate – how much an investor is expected to withdraw from their portfolio net of inflation or the expected increase in the cost of living;
- Expected Portfolio Return – how much an investor is expected to earn on their portfolio net of inflation or the expected increase in the cost of living;
- Expected Portfolio Volatility –the expected portfolio standard deviation or how much their portfolio return is expected to fluctuate on average.
Based on these inputs, the SPV model can calculate the risk of ruin (or risk of failure) for a particular spending plan. For example, assume a 65-year-old male at the start of retirement with a life expectancy of 19 years, a 5% withdrawal rate, and has the choice of different investment portfolios that each have a 6% expected return, but six different levels of expected volatility: 5%, 7.5%, 10%, 15%, 20% and 30%. Let’s see what happens to the risk of financial ruin as volatility increases:
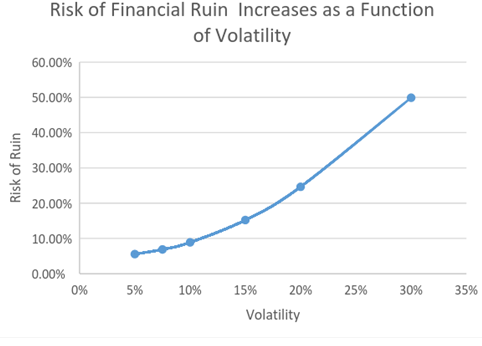
As we can clearly see, the risk of financial ruin climbs exponentially as a function of rising volatility. This is an immutable mathematical fact. Incredibly, an investor with a portfolio with a 20% volatility expectation in this example would have a risk of ruin that is nearly 3x higher than an investor with a portfolio with a 10% volatility expectation. Intuitively this relationship makes sense: higher volatility leads to a greater chance of having large drawdowns, which in turn can cause investors to withdraw from their portfolio at the worst possible times. In fact, if this graph were to depict the actual behavior of investors, the actual risk of ruin would be much higher. This is because investors tend to change their asset allocation to be either more aggressive or conservative at the wrong times due to their emotional biases. This causes them to have greater exposure to volatility on average than if they had stuck with their asset allocation, and hence a much higher risk of ruin.
Another way to measure the impact of volatility is to see how much a typical investor would be able to withdraw from their portfolio given a high degree of confidence that they will not experience financial ruin. In this case, we will use the same example to calculate what their sustainable or safe withdrawal rate should be given a 1% chance of financial ruin. This can be easily calculated using the same framework.
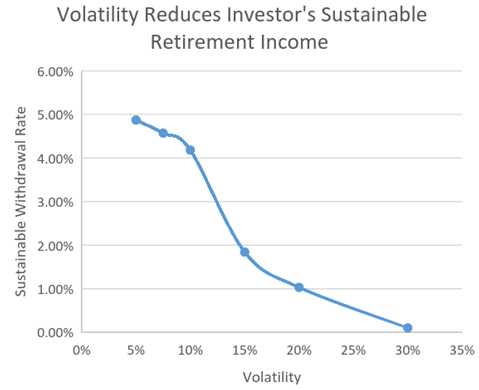
As you can clearly see, lower levels of volatility allow an investor to withdraw a greater amount of income from their portfolios in retirement. In fact, a portfolio with a 5% volatility can sustain withdrawals nearly 5x the annual retirement income as a portfolio with 20% volatility with the same risk of ruin. This is perhaps the most important finding for investors that are near or within the withdrawal stage: you can actually have a better standard of living in retirement if you have a lower risk portfolio. We have demonstrated that this is true holding returns constant, but counterintuitively it is possible for a portfolio to have a lower return and still produce greater sustainable retirement income than a portfolio that has a higher return. As an example, a portfolio that earns 5% with a 10% volatility has a sustainable withdrawal rate of 2.21%; in contrast a portfolio that earns 6% with 20% volatility has a sustainable withdrawal rate of just 1.03% (assuming an investor of the same age and life expectancy). Despite having a lower return, the first portfolio allows an investor to withdraw more than double the retirement income as the second portfolio.
The importance of these examples cannot be overstated – managing risk is essential to maximizing both the odds of achieving financial goals, and also the standard of living that can be sustained in retirement. This is mathematically true assuming investors systematically follow a given asset allocation. It has an even greater implications in the real world because it also reduces the likelihood that investors will make poor financial decisions by changing their asset allocation during periods of high volatility. If managing risk is so powerful, clever investors may ask how it is possible to design portfolios that can earn the same returns as a passive/static mix of asset classes and still reduce risk. As it turns out, this is where dynamic or tactical approaches to asset allocation shine versus their passive counterparts.
In the next article, we will show why it pays to be active with your asset allocation in retirement.
Milevsky, Moshe A., and Chris Robinson, 2005. “A Sustainable Spending Rate without Simulation,” Financial Analysts Journal, Vol. 61, No. 6, pp. 89-100.
Yang, George, and Wagner, Jerry, 2014. “Bull, Bear and Sideways Markets, A Tri-State Market Classification for Evaluating Investment Strategies.
Calculations based on Professor Milevsky’s spreadsheet, available at the web site of the Individual Finance and Insurance Decisions Centre in Toronto: www.ifid.ca/pdf_cri_lectures/Lecture8_Sheet2.xls
BSAM and its affiliates do not render advice on tax and tax accounting matters to clients. This material was not intended or written to be used, and cannot be used or relied upon by any recipient, for any purpose, including the purpose of avoiding penalties that may be imposed on the taxpayer under U.S. federal tax laws.
The author(s) principally responsible for the preparation of this material are expressing their own opinions and viewpoints, which are subject to change without notice and may differ from the view or opinions of others at BSAM or its affiliates. Any conclusions presented are speculative and are not intended to predict the future of any specific investment strategy. This material is based on publicly available data as of the publication date and largely dependent on third party research and information which we do not independently verify. We make no representation or warranty with respect to the accuracy or completeness of this material. One cannot use any graphs or charts, by themselves, to make an informed investment decision. Estimates of future performance are based on assumptions that may not be realized and actual events may differ from events assumed. BSAM is not acting as a fiduciary in presenting this material. Benchmark indices are presented for illustrative purposes only and do not account for deduction of fees and expenses incurred by investors.
The strategies discussed in this material may not be suitable for all investors. We urge you to talk with your investment adviser prior to making any investment decisions.