Macro Risk Indicator: Our Approach to Managing Risk
We are commonly asked about the method we use to tilt our Dynamic Asset Allocation (DAA) portfolios between an offensive or defensive stance. Based upon years of extensive research we have developed what we refer to as The Macro Risk Indicator (MRI). The MRI is employed in the DAA models to determine whether to emphasize holding defensive assets such as treasury bonds or offensive assets such as equities. The MRI doesn’t forecast the future using obscure economic indicators as the name might suggest, but rather it uses momentum and trend-following to make decisions. Both momentum and trend-following of which have been demonstrated within academia and in practice by some of the world’s top portfolio managers to be the single most robust approach to making systematic decisions in financial markets (To learn more please read our whitepaper on Momentum). We apply the proven concepts of momentum and trend-following on the broad equity market indices such as Vanguard Total Stock Market – VTI or iShares S&P 500 Index – SPY. Why VTI/SPY you may ask? These indices are very good proxies for economic growth expectations that have a measurable and consistent effect on virtually all other assets classes.
It is important to note that the MRI is not an on/off switch, but rather a probabilistic assessment of whether the broad stock market offers returns that are likely to be above earning a return on cash or treasury bonds. The MRI ranges from 0% to 100% in 25% increments – 0%, 25%, 50%, 75%, 100% – with a 100% position being most offensive and 0% being most defensive. The goal of the MRI is to buy on market strength and sell on market weakness and to capture the long-term return of the underlying market while reducing exposure to bear markets.
As an example of the effectiveness of our MRI when applied to the Vanguard Total Market Index ETF (VTI) you can clearly see the improvement in the chart below. This approach could be applied to any asset class and have similar results, and when taken a step further in the context of a portfolio can be implemented even more surgically taking into account more asset class specific parameters.

Why is all this MRI stuff important? Managing downside risk is critical to growing (and sustaining) your investments.
Most investors will need to rely on their investment portfolios to meet all or part of their future income needs. In order to accomplish this, they must be able to make withdrawals from their portfolio while the portfolio continues to grow in order to meet their required standard of living. Unfortunately, empirical data has shown that the stock market does not behave “normally” like a random distribution. Instead, markets exhibit what are called “fat tails,” or instances where a higher probability of large losses exists than what would normally be expected. In the graphic below we see that the probability of gains is approximately normally distributed, while the probability of losses demonstrate several examples of exceptionally large monthly losses.
Source: BSAM, Data Source: Commodity Systems Inc.

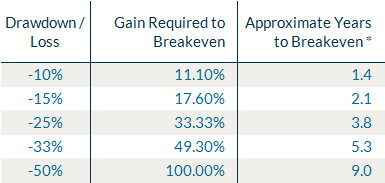
The implication is that we need to “self-insure” our portfolios by observing the market distribution. This can be accomplished by dynamically adjusting our exposure as the loss distribution begins to overtake the gains. Using our previous example with the math of compounding, a decline similar to what we saw in 2008 would require a 100% gain to breakeven. Recently the recovery from the credit crisis took over 4 years from the lows set in 2008 to surpass the highs set back in 2007. Many investors did not fully recover from this bear market because they raised cash in 2008 when things got really bad. Furthermore, those investors that were forced to make a high level of income withdrawal saw their portfolios shrink substantially.
While the recovery from 2008 seemed to support the popular advice that investors should not panic and simply buy and hold to ensure low principal risk, this notion is not supported by academia. The father of passive investing William Sharpe has pointed out that investors and financial advisors often make the mistake of assuming that the market will always recover, and that the recent rebound from 2009 has only strengthened this false assumption (source: “How to Invest in a Turbulent Market”, 2013, William Sharpe, Stanford Business School). Academic research strongly supports trend-following and momentum, and has proven to be one of the best ways to mitigate the risk of a large drawdown when the market is going downhill. Therefore having a Macro Risk Indicator that can apply the brakes when risk of loss is getting higher can help smooth the ride and reduce the likelihood of having large drawdowns.


To further substantiate the power of the MRI we need to evaluate the success by which its tilts between offense and defense are successful. This is an important factor in determining how the MRI will continue to prove its value in assisting investors protect and grow their investable wealth.

With roughly 65% winning decisions, the Macro Risk Indicator has been substantially more accurate than simply flipping a fair coin. But accuracy is not as critical for momentum or trend-followers as the size of the average gain relative to the size of the average loss. Many trend-following systems have winning percentages that are actually lower than 50%, but the average win is much higher than the average loss. For our Macro Risk Indicator, the average win is 50% greater than the average loss, and coupled with a good winning percentage for a trend-following system it is less likely that an investor will sustain large losing streaks. Using a simple binomial probability, the odds of two losses in a row are roughly 12% (odds of a loss are 100%-65% or 35% to the exponent of 2). Using the same math, a streak of 5 losses in a row has probability that is close to zero.

As we can see in the example, the longest losing streak has been 4 consecutive losses, with a cumulative loss of only 8%. While we cannot forecast the winning percentage and average loss of the Macro Risk Indicator into the future, it is fair to say that the whipsaws (or cost of insurance against a large loss) are a fair cost to bear in order to preserve capital against a large protracted downturn at some point in the future.
Conclusion
A Macro Risk Indicator based on momentum is quite a valuable weapon in the portfolio management process for determining the offense versus defense decision towards risky assets. This is especially critical for stabilizing the portfolio from large and protracted drawdowns caused by bear markets. However the cost of dynamically adapting exposure to market performance in real-time is that there will invariably be false signals. Our analysis has shown that the probability of losing trades is reasonably low, especially when considering extended streaks of losses. The magnitude of these losses is also fairly low since losing trades are much shorter in duration than winning trades. False signals are common for these strategies, but are a fair cost to bear for improving the risk profile of investor portfolios. Time-series momentum and trend-following strategies employed by the Macro Risk Indicator have shown throughout market history to be the most robust and successful method for reducing risk.
This article includes an illustrative example of the application of the BSAM Macro Risk Indicator and its application to a simple example using the Vanguard Total market Index ETF (VTI) and the iShares Barclays 7-10 Year Treasury Bond Fund ETF (IEF). The method used to calculate the Offense/Defense percentage is based on the rate of change of the exchange traded funds during specific time weighted periods with equal allocation to the total portfolio. If the period is positive, then it is offensive, if not positive then defensive. As an example, if 2 of the 4 periods are positive, the allocation would be 50% offense, 50% defense. No investment advisory or management fees are taken into account when calculating the hypothetical performance of any example contained herein. Our managed adaptive portfolios employ more sophisticated allocation techniques and diversified investment opportunities than the sample adaptive portfolio. As such the results presented here are not necessarily indicative of performance that would have been actually achieved if an account utilized our actual dynamic strategies during the relevant periods, nor are these results necessarily indicative of future performance of the strategy. There is risk of loss with any investment and past performance is not a guarantee of future results. Any graphs or charts cannot by themselves guide you in making any investment decision. The information used to compile the data, graphs and charts herein is significantly based on third-party reported information and may not take into account all relevant factors one needs to draw conclusions, such as risk, volatility and diversification.